This release adds a 'Marketing Analytics' notebook that shows how you can fully analyze behavior of users who enter your site/app via marketing efforts, in order to understand what really drives your product goals.
Using the open model hub or your own models, you can deep-dive into the raw marketing data from a notebook. Example analyses are conversion, time spent, features/content and journeys that drive conversion or drop-off, predicting if users will convert, etcetera - all split by marketing source/campaign/creative.
Examples
Let’s look at a few examples from the notebook.
First off: Funnel Discovery - flows for converted or dropped-off users
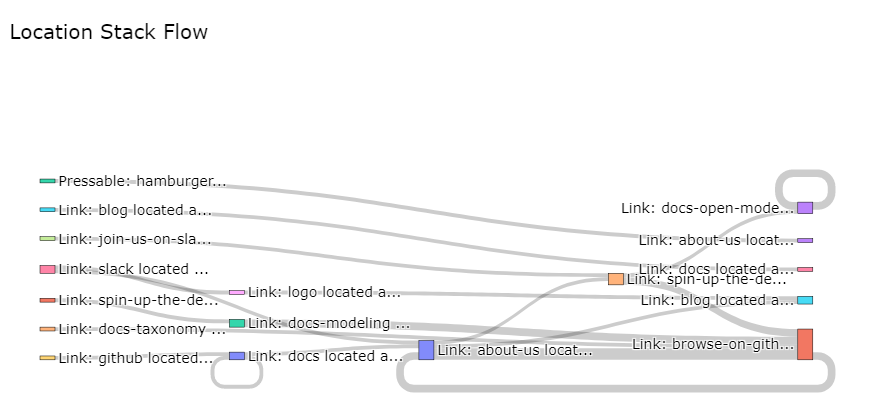
Users entering from marketing subsequently take all sorts of paths in your site/app that have an impact on your product goals, e.g. conversion to a signup. The Funnel Discovery model helps you uncover which of these paths have an impact, and which do not, and find opportunities to improve your landing pages & campaigns.
How: you can easily filter your data to only look at users coming from a certain marketing source, campaign or creative, and then use the Funnel Discovery model to plot the paths users take.
# filter the dataframe down to users that came in via a marketing campaign
user_list = df_marketing[~df_marketing['utm_campaign'].isnull()].user_id
df_marketing = df_marketing[df_marketing['user_id'].isin(user_list)]

# instantiate the FunnelDiscovery model from the open model hub
funnel = modelhub.get_funnel_discovery()
# get paths that resulted in conversion (we assume here that conversion has been defined earlier)
df_steps_till_conversion = funnel.get_navigation_paths(df_marketing, steps=4, by='user_id', add_conversion_step_column=True, only_converted_paths=True)

# plot the Sankey diagram using the top 15 examples via the `n_top_examples` param
funnel.plot_sankey_diagram(df_steps_till_conversion)
Resulting in the following flow diagram:

Example flow diagram for users from marketing campaigns.
You can interact with this diagram to understand the paths that lead to conversion, and decide which to analyze further.
Of course, you can also run the analysis for users who do not convert instead, and understand what makes them drop off.
Secondly: Time spent by converted users
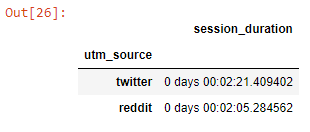
Users entering from marketing spend a certain amount of time on your site/app, and then either convert to one of your product goals, or drop off. The session_duration model from the open model hub enables you to understand this behavior, split by marketing source/campaign/creative and landing pages.
This allows you to optimize landing pages or direct ad spend to the right efforts.
# for example: avg. duration for converted users - per source
modelhub.aggregate.session_duration(df_marketing, groupby=['utm_source']).head()

Resulting output for average duration per source.
You can run more in-depth analyses on this raw data, such as drilling down duration to each converted user (which can also be used for conversion prediction), or filtering out bounces (users with zero duration) that skew your analyses.
Other examples of analyses
- Conversion & conversion rate by marketing source/campaign/creative.
- Top used product features (before conversion) by marketing source/campaign/creative.
- Predict User Behavior by marketing source/campaign/creative: for example, which campaign is a good predictor to convert users.
How to get it
See the example notebook in our documentation, or download the Jupyter notebook directly from our repo.
Office Hours
If you have any questions about this release or anything else, or if you just want to say 'Hi!' to team Objectiv, we have Office Hours every Thursday at 4pm CET, 10am EST that you can freely dial in to. If you're in a timezone that doesn’t fit well, just ping us on Slack and we'll send over an invite for a better moment.