
In this release we added a Retention Matrix model to the open model hub, that enables you to run retention analysis directly on your data store, with just one operation. No need for data cleaning or building complex SQL queries. Next to overall retention analysis, it also enables you to drill down directly; you can quickly segment each cohort and stack ready-to-use models on top, like which top features are being used.
Use the new model to drive product adoption by understanding to what extent users return to your product, whether that improves over time, and how each cohort behaves in detail.
A demo
To build a Retention Matrix, you just need a dataframe with Objectiv data containing user_ids and moments,
which are the dates for events that we consider relevant user activity.
You call the retention_matrix operation from the open model hub, and choose the
desired timeframe (daily, weekly, monthly, or yearly) to use for the mutually exclusive cohorts that users
will be distributed into:
retention_matrix = modelhub.aggregate.retention_matrix(df, time_period='monthly', percentage=True, display=True)
retention_matrix.head()
The result is shown in a heatmap (or as a dataframe, with parameter display=False):
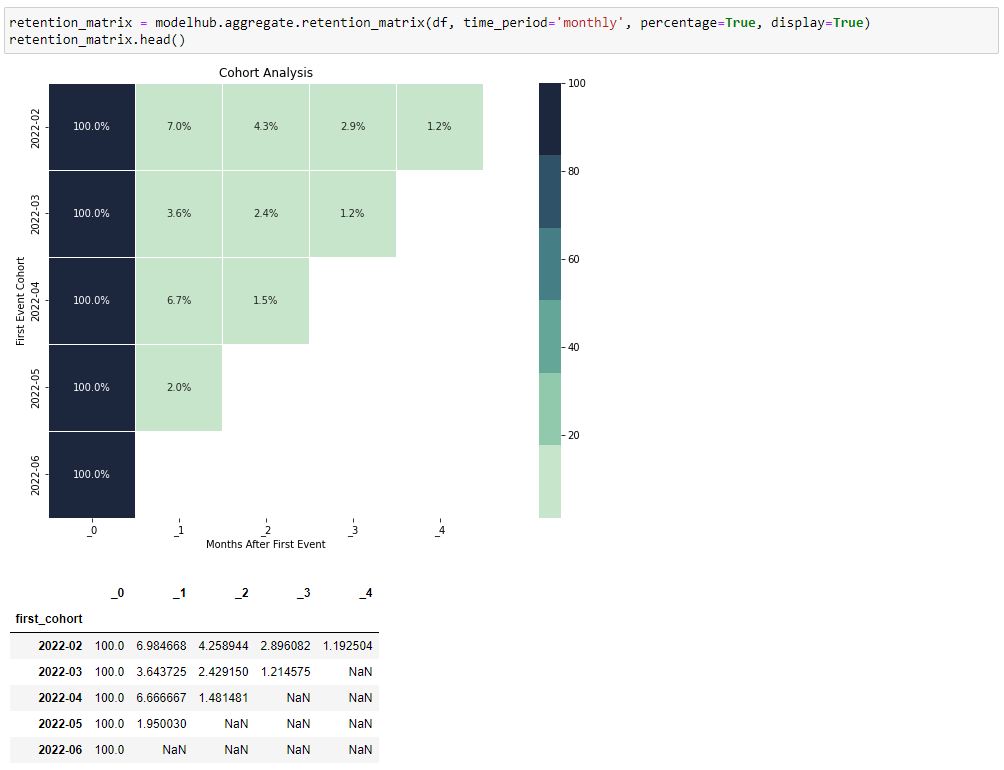
What you see here is that:
- Each row represents a cohort - in this case months;
- Each column represents a time range, calculated with respect to the cohort start time - in this case number of months after the cohort’s start month;
- The values are the percentage or number of users in a given cohort that returned in that time range.
That’s it! Retention analysis straight out of the box, on raw analytics data.
Drilling down cohorts with ready-to-use models
In the Retention Matrix above, we can see that in the second cohort (of 2022-03) there’s a drop in retained users in the next month. Only 3.6% returned, whereas in the previous month’s cohort, this was 7.0%.
Let’s zoom in on these cohorts to analyze their differences, which we can now easily do, directly on the raw data.
First we calculate which cohort each user falls in, and add it to our dataframe:
cohorts = df[['user_id', 'moment']].groupby('user_id')['moment'].min().reset_index()
cohorts = cohorts.rename(columns={'moment': 'first_cohort'})

# add first cohort of the users to our DataFrame
df = df.merge(cohorts, on='user_id', how='left')
Then we create the segment of users in the first month (2022-02) by simply filtering on the time range, and see which features they used and how often:
cohort0_filter = (df['first_cohort'] > datetime(2022, 2, 1)) & (df['first_cohort'] < datetime(2022, 3, 1))
df[cohort0_filter]['event_type'].value_counts().head()
Those users used the following features:
event_type
VisibleEvent              3091
PressEvent                2928
ApplicationLoadedEvent    2234
MediaLoadEvent            1082
MediaStartEvent           528
Name: value_counts, dtype: int64
Now let’s look at what users did who are in the problematic segment:
cohort1_filter = (df['first_cohort'] > datetime(2022, 3, 1)) & (df['first_cohort'] < datetime(2022, 4, 1))
df[cohort1_filter]['event_type'].value_counts().head()
These ‘problematic’ users used the following features:
event_type
PressEvent                760
VisibleEvent              645
ApplicationLoadedEvent    536
MediaLoadEvent            267
HiddenEvent               90
Name: value_counts, dtype: int64
As you can see the ‘problematic’ users generated relatively less VisibleEvents than the
ones in the first cohort. Based on this we could form a hypothesis that something might be wrong on one of the
key screens. We can then drill down into this with more models from the open model hub, to further analyze the
exact screens that are most used.
Of course this is a basic analysis just for demonstration purposes. But: you can run any advanced analysis on
the full data set, and use it with any of the models in the open model hub, like the
top_product_features_before_conversion (to find out what users
did before converting to a certain product goal).
Translated to SQL
The model hub translates all operations to SQL under the hood, so it can run directly on the data store. Retention analysis is a complex analysis to write in SQL, but luckily the model hub handles the complexity. See a snippet of the resulting SQL below, which you can export to your solution of choice, like a BI-tool or dbt:
[...snip: retrieve session data (users & event)]

"merge_sql___180c691b1a336749f26fe0cb84980749" as (
            select "l"."event_id" as "event_id", COALESCE("l"."user_id", "r"."user_id") as "user_id", "l"."moment" as "moment", "r"."moment" as "first_cohort_ts"
            from "objectiv_sessionized_data___ae605b672716871d4520f5ccf2a32aef" as l inner
            join "reset_index___8ecacea309f694e7adf2c550f682b2d3" as r on ("l"."user_id" = "r"."user_id")
            ),
"reset_index___26aa7cb9be668352ac8952e95fc14d45" as (select to_char("first_cohort_ts", 'YYYY"-"MM') as "first_cohort", ('_' || cast((((cast(to_char("moment", 'YYYY') as bigint) - cast(to_char("first_cohort_ts", 'YYYY') as bigint)) * cast(12 as bigint)) + (cast(to_char("moment", 'MM') as bigint) - cast(to_char("first_cohort_ts", 'MM') as bigint))) as text)) as "cohort_distance", count(distinct "user_id") as "user_id_nunique"
from "merge_sql___180c691b1a336749f26fe0cb84980749"

group by to_char("first_cohort_ts", 'YYYY"-"MM'), ('_' || cast((((cast(to_char("moment", 'YYYY') as bigint) - cast(to_char("first_cohort_ts", 'YYYY') as bigint)) * cast(12 as bigint)) + (cast(to_char("moment", 'MM') as bigint) - cast(to_char("first_cohort_ts", 'MM') as bigint))) as text))

),
"unstack___05236a24319380a1f3e314323146784c" as (select "first_cohort" as "first_cohort", max("user_id_nunique") as "user_id_nunique", max("cohort_distance") as "cohort_distance", max(CASE WHEN ("cohort_distance" = '_2') THEN "user_id_nunique" ELSE cast(NULL as bigint) END) as "_2__user_id_nunique", max(CASE WHEN ("cohort_distance" = '_4') THEN "user_id_nunique" ELSE cast(NULL as bigint) END) as "_4__user_id_nunique", max(CASE WHEN ("cohort_distance" = '_3') THEN "user_id_nunique" ELSE cast(NULL as bigint) END) as "_3__user_id_nunique", max(CASE WHEN ("cohort_distance" = '_0') THEN "user_id_nunique" ELSE cast(NULL as bigint) END) as "_0__user_id_nunique", max(CASE WHEN ("cohort_distance" = '_1') THEN "user_id_nunique" ELSE cast(NULL as bigint) END) as "_1__user_id_nunique"
from "reset_index___26aa7cb9be668352ac8952e95fc14d45"

group by "first_cohort"

)
select "first_cohort" as "first_cohort", ((cast("_0__user_id_nunique" as double precision) / "_0__user_id_nunique") * cast(100 as bigint)) as "_0", ((cast("_1__user_id_nunique" as double precision) / "_0__user_id_nunique") * cast(100 as bigint)) as "_1", ((cast("_2__user_id_nunique" as double precision) / "_0__user_id_nunique") * cast(100 as bigint)) as "_2", ((cast("_3__user_id_nunique" as double precision) / "_0__user_id_nunique") * cast(100 as bigint)) as "_3", ((cast("_4__user_id_nunique" as double precision) / "_0__user_id_nunique") * cast(100 as bigint)) as "_4"
from "unstack___05236a24319380a1f3e314323146784c"

order by "first_cohort" asc nulls last
Summary
The new Retention Matrix model in the open model hub enables you to easily run retention analysis directly on your data store, with just one operation. No need to clean data or build complex SQL queries, as the model hub takes care of this. Each cohort can then be easily segmented in order to drill-down into the user behavior, with ready-to-use models.
You can use this to drive product adoption by understanding to what extent users return to your product, whether that improves over time, and how each cohort behaves in detail.
Office Hours
If you have any questions about this release or anything else, or if you just want to say 'Hi!' to team Objectiv, we have Office Hours every Thursday at 4pm CET, 10am EST that you can freely dial in to. If you're in a timezone that doesn’t fit well, just ping us on Slack and we'll send over an invite for a better moment.